Portfolio Value Tracking
Track your ETF holdings with real-time value calculations. Enter your shares and instantly see your total portfolio value in your preferred currency.

Track Your SPDR MSCI ACWI IMI ETF with Professional Analytics
Track and analyze your SPDR MSCI ACWI IMI UCITS ETF investment with live NAV updates, historical charts, drawdown analysis, and complete holdings transparency. Full support for both SPYI (Accumulating) and SPSA (Distributing) share classes across 4,500+ holdings in developed and emerging markets. Available on iPhone, iPad, Apple Watch, and Mac.
Track your ETF holdings with real-time value calculations. Enter your shares and instantly see your total portfolio value in your preferred currency.
Get current ETF prices throughout the trading day. Multi-currency support across USD, EUR, GBP, CHF, JPY, CAD, AUD, CNY, HKD, and SGD.
View interactive price history with multiple timeframes (1M, 3M, 6M, 1Y, All) and overlay 38-, 50-, 100-, and 200-day moving averages to spot long- and short-term trends.
Visualize risk with a dedicated underwater chart that shows how far the ETF has fallen below its peaks and how long recoveries take.
Full support for both Accumulating (SPYI) and Distributing (SPSA) share classes — including separate holdings sets. Switch between share classes and compare historical performance.
Three analytical views combined: summary statistics (all-time high/low with dates, average, median, standard deviation, data points), return & risk metrics (CAGR, total change, best/worst day), and daily movement analysis (positive/negative days, longest winning/losing streaks).
See how your investment is distributed across the globe with visual maps, country-by-country allocation percentages, and interactive country-based filtering.
Detailed sector weightings, industry concentration analysis, and visual breakdowns. Compare sectors across regions and filter holdings interactively.
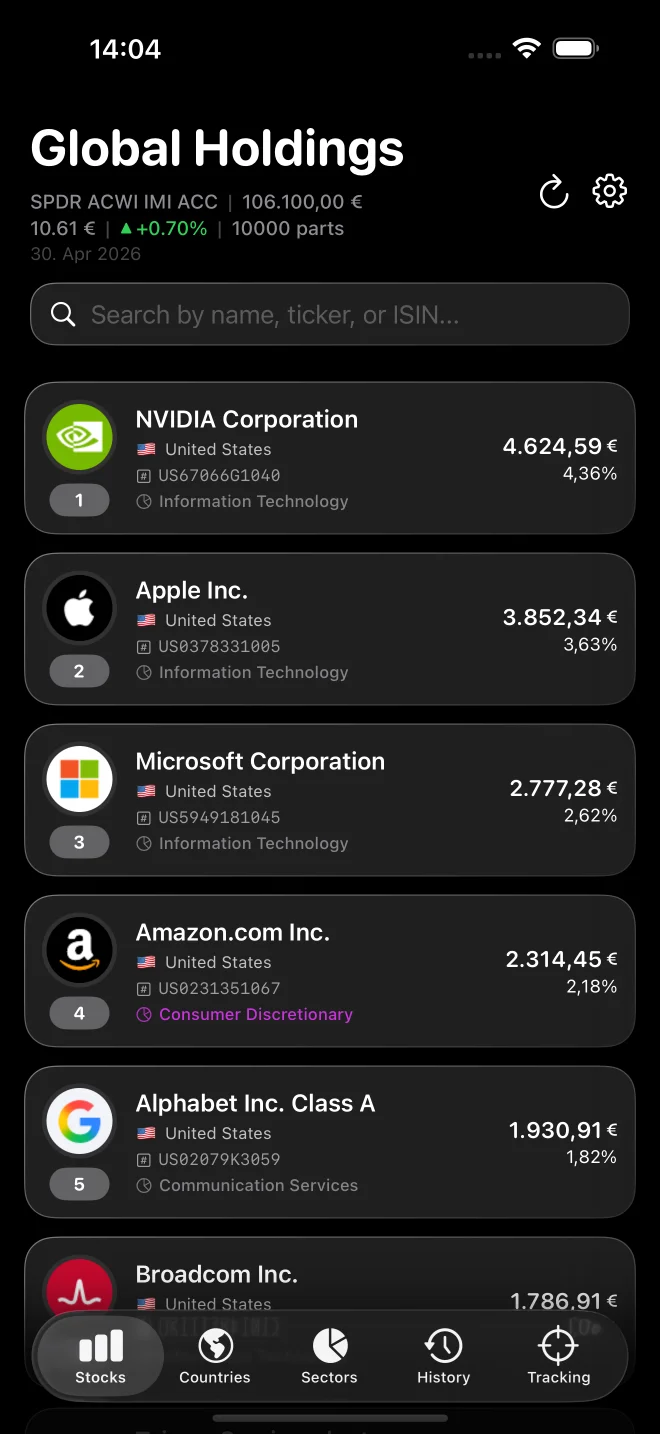
Browse all 4,500+ individual holdings with real-time weightings. Search and filter by company, country, sector, or ISIN — and discover stocks you never knew were inside the fund.
Comprehensive support for 10 major currencies: USD, EUR, GBP, CHF, JPY, CAD, AUD, CNY, HKD, and SGD. Switch currencies anytime and watch all charts and statistics update instantly.
iCloud keeps your settings, snapshots, and history synchronized across iPhone, iPad, Apple Watch, and Mac — so your portfolio is always in sync wherever you check it.
Native Apple Watch app plus watch face complications. Check live SPYI and SPSA performance directly on your wrist without opening the iPhone app.
Small and medium home screen widgets show your SPYI/SPSA performance at a glance — stay on top of your investment without opening the app.
Adaptive landscape layout takes full advantage of the iPad display — browse holdings, compare sectors, and study charts with more detail and comfort.
Native SwiftUI macOS app — not Catalyst. Analyze holdings, view charts, and track your portfolio on the big screen. Universal purchase: buy once, use on all your Apple devices.
All portfolio calculations happen locally on your device. No accounts, no tracking, no personal financial information collected.
SpiderLens is a portfolio tracking and analysis app built specifically for the SPDR MSCI ACWI IMI UCITS ETF — one of the broadest global equity ETFs available to European investors. Track your investment with live NAV updates, historical charts with moving averages, a dedicated drawdown chart, comprehensive statistics (CAGR, volatility, streaks), and detailed holdings breakdown across 4,500+ stocks, countries, and sectors.
Yes. SpiderLens fully supports both share classes of the SPDR MSCI ACWI IMI UCITS ETF: SPYI (Accumulating) and SPSA (Distributing). Each share class has its own holdings set so you always see exactly what is inside the version you own.
SpiderLens runs natively on iPhone, iPad (with adaptive landscape layout), Apple Watch (native Watch app and complications), and Mac (native SwiftUI app — not Catalyst). iCloud keeps your settings, snapshots, and history in sync across all your devices. iPhone widgets in small and medium sizes are also included.
A full statistics dashboard with three views: Summary (all-time high/low with dates, average, median, standard deviation, data points), Return & Risk (CAGR, total change, best/worst day), and Daily Movement (positive/negative day counts, longest winning streak, longest losing streak). All metrics update dynamically based on the selected share class and time range.
The dedicated drawdown chart visualizes how far the ETF has fallen below its all-time peak at any point in history and how long it took to recover. It is one of the clearest ways to assess real-world risk and emotional resilience for a long-term investor.
SpiderLens supports 10 major currencies: USD, EUR, GBP, CHF, JPY, CAD, AUD, CNY, HKD, and SGD. Charts and statistics update instantly when you switch currencies.
Yes. All portfolio calculations are performed locally on your device. No user accounts, no tracking, no personal financial information is collected or transmitted. Synchronization between your own devices uses your private iCloud account.
Track Your SPDR MSCI ACWI IMI ETF with Professional Analytics
For the latest features and detailed information, please visit the app on its store page.
SpiderLens is an independent analysis and portfolio tracking tool and is not affiliated with, endorsed by, or connected to State Street Global Advisors, SPDR, MSCI, or any other financial institution. This app is for informational and educational purposes only and does not constitute financial advice. Historical performance does not guarantee future results. Always consult with qualified financial professionals before making investment decisions. Data Sources: Holdings analysis based on publicly available SPDR MSCI ACWI IMI UCITS ETF data. Historical prices and live NAV data sourced from publicly available market data feeds.